> For the complete documentation index, see [llms.txt](https://docs.coda.co/llms.txt). Markdown versions of documentation pages are available by appending `.md` to page URLs; this page is available as [Markdown](https://docs.coda.co/general-information/coda-portal/key-features/data-insights/3.-transaction-failures-dashboard-details-page.md).
# 3. Transaction Failures Dashboard Details Page
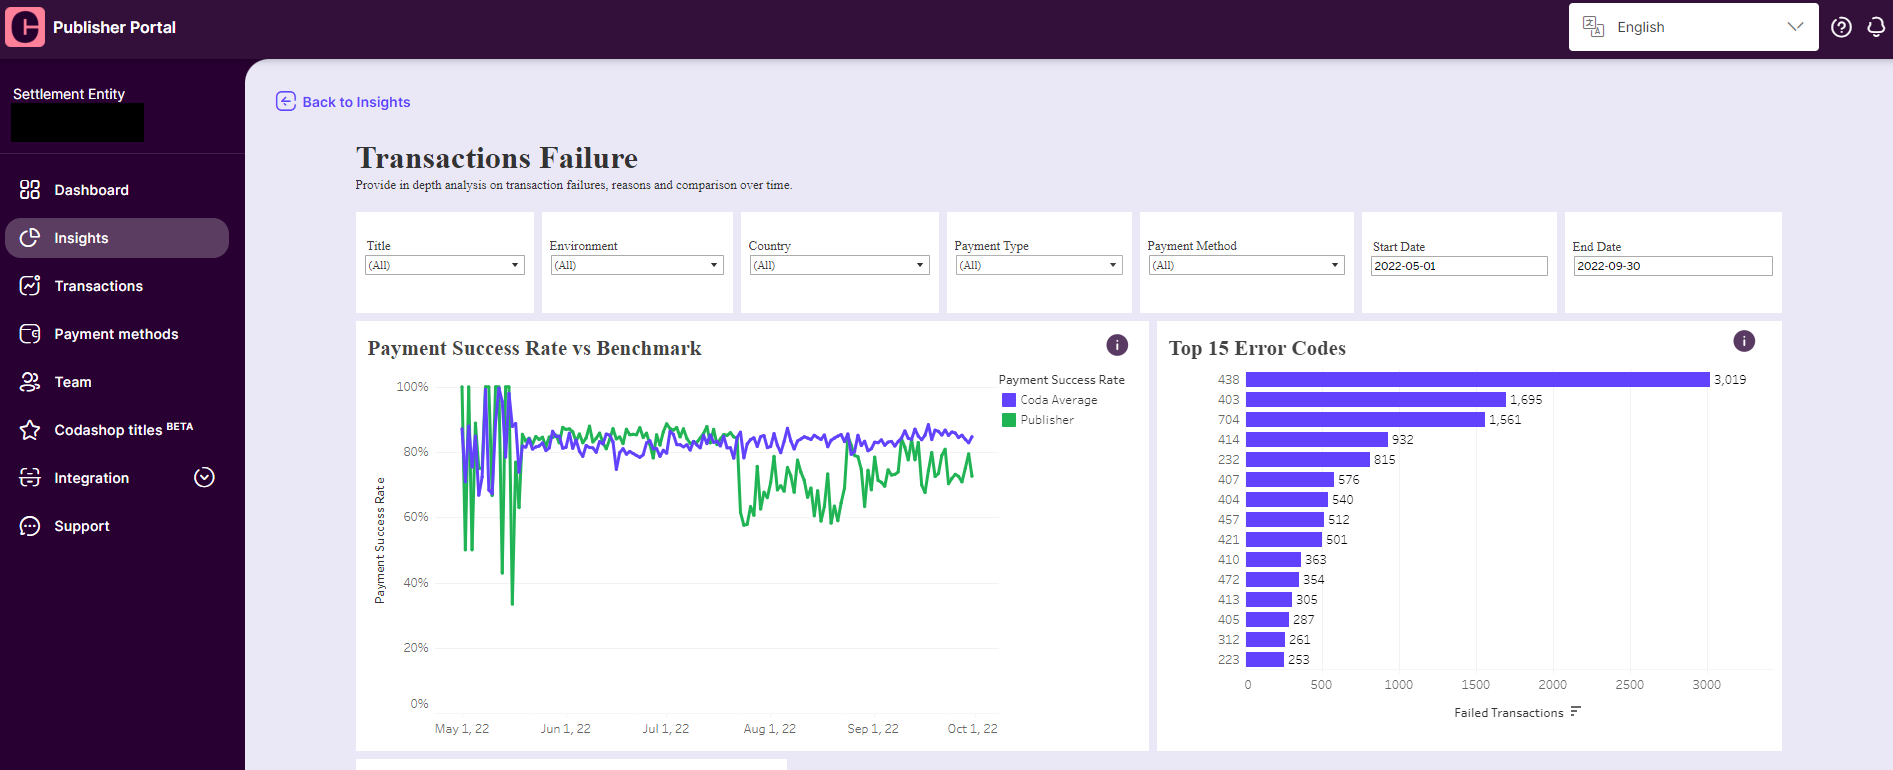
The Transaction failure dashboard gives an overview of payment success rates and error code analytics for your transactions.
You can easily identify the most frequent error codes that are encountered in a given period and dive deeper to analyze the reasons for the failed transactions.
We also provide Coda’s average payment success rate trendline as a benchmark for comparison.
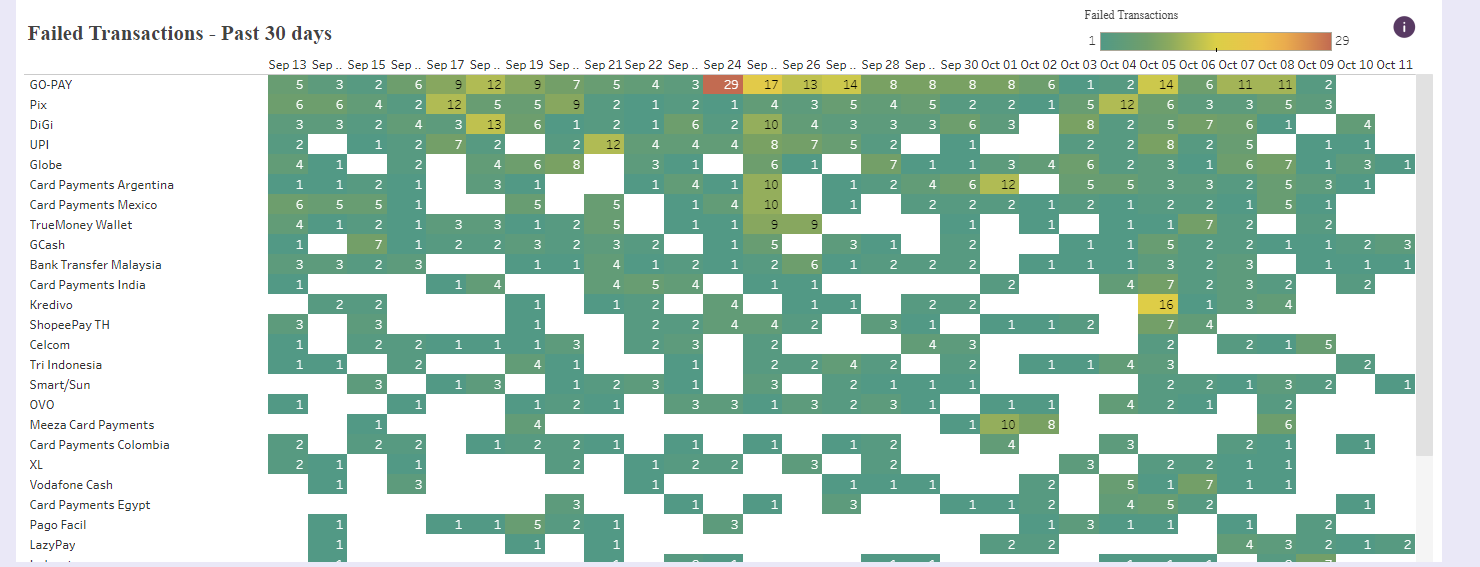
You can also check the daily error code analysis using the below chart and identify the days with the highest failures for a deeper analysis.\
\
*For example here, Sep 24th Go-Pay experienced the highest number of failed transactions.*
---
# Agent Instructions
This documentation is published with GitBook. GitBook is the documentation platform designed so that both humans and AI agents can read, navigate, and reason over technical content effectively. Learn more at gitbook.com.
## Querying This Documentation
If you need additional information that is not directly available in this page, you can query the documentation dynamically by asking a question.
Perform an HTTP GET request on the current page URL with the `ask` query parameter, and the optional `goal` query parameter:
```
GET https://docs.coda.co/general-information/coda-portal/key-features/data-insights/3.-transaction-failures-dashboard-details-page.md?ask=&goal=
```
`ask` is the immediate question: it should be specific, self-contained, and written in natural language.
`goal` is optional and describes the broader end goal you are ultimately trying to accomplish on behalf of the user. GitBook uses it to tailor the answer towards what is most useful for that goal.
The response will contain a direct answer to the question and relevant excerpts and sources from the documentation.
Use this mechanism when the answer is not explicitly present in the current page, you need clarification or additional context, or you want to retrieve related documentation sections.